Overview of Power BI
A series of basic tutorials & resources designed to guide new & existing Power BI end users in the capabilities of Power BI.
What is Power BI?
*Please note: Power BI is updated every few months. The videos and images have been recorded using the version released in March 2023, so you may see slight modifications to your interface.
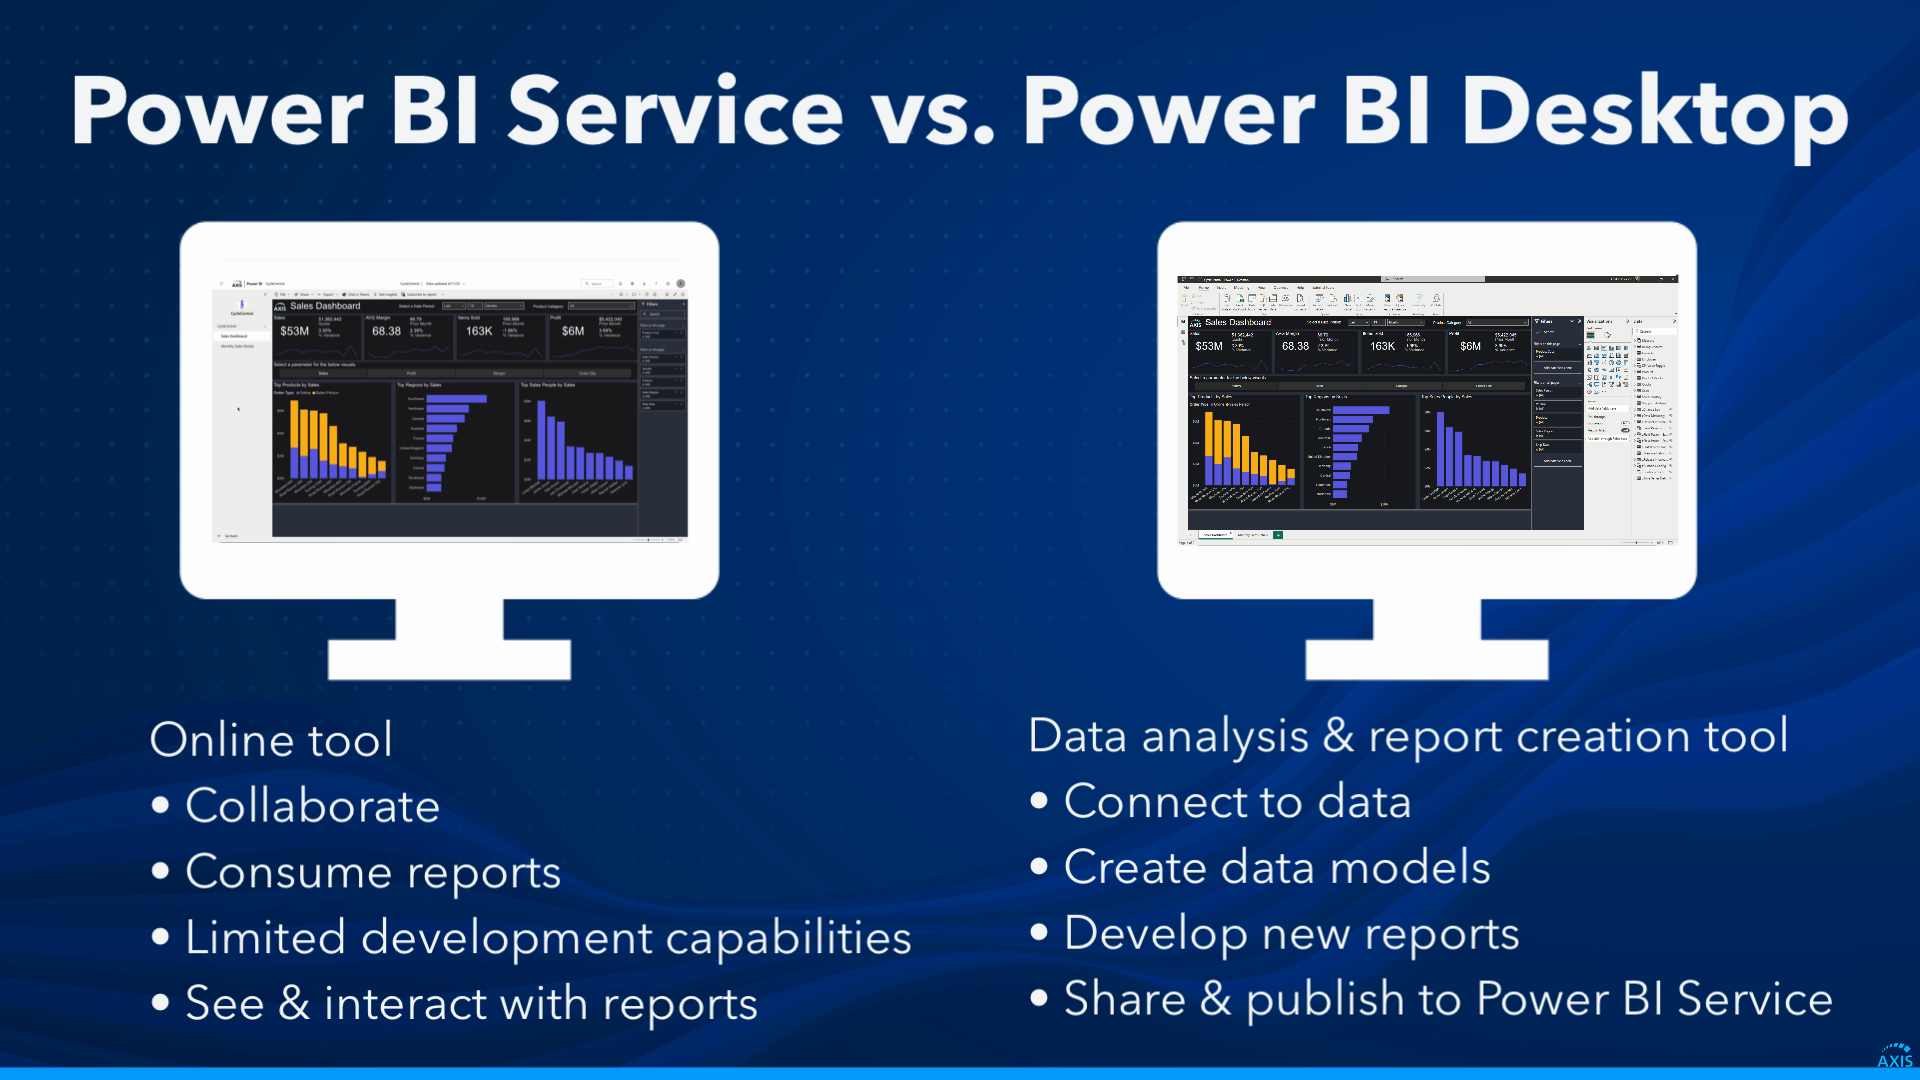
Power BI Service vs Desktop
Power BI Service: A cloud-based application you access online. Service is designed more for collaboration and report consumption, than development. There are basic editing and report creation functions on Power BI Service, but it doesn’t have the same deep features and functionalities that Power BI Desktop does.
Power BI Desktop: A more traditional Windows application for data analysis and report creation that lets you connect to and transform data, create data models, and develop new reports based on those models. You can then share those reports with others by publishing them to Power BI Service, accessible online.

Key Vocabulary
(SO) = Power BI Service Only ; (DO) = Power BI Desktop Only ; (SD) = Both Power BI Service & Desktop
Report: multi-page collection of visualizations that present detailed data insights (SD)
Dashboard: single-page canvas that serves as a summarized view of key metrics across multiple reports (SO)
Application: bundled reporting solution consisting of multiple reports, dashboards, and data within a workspace (SO)
Workspace: collaborative environment (similar to a folder) where you can view and share the content within, between users (SO)
Dataset: collections of data tables from different sources. Used to consolidate, transform, and create relationships between data elements (DO)
Dataflow: data preparation and transformation capability that uses a defined ETL process. Can be shared across multiple reports and datasets, ensuring consistency throughout data, reducing the need for duplication (SO)